Caught Looking: Articles of the Week — November 5
Here are three studies the R&D department at Driveline read this week:
Cross-sectional comparison of the probabilistic structure in the distribution of pitching location among baseball pitchers of different ages
Studying the skill of command in pitching seems like an easy task—but that’s not necessarily true without conducting a controlled experiment. Using in-game data and video makes it doable, but you have to assume the target is where the catcher’s glove is, which is a less-than-perfect measurement of the pitcher’s target.
Ogawa et al. at the University of Tokyo studied the difference in pitching command performance between different athletes’ age groups. There were 78 total athletes, including elementary schoolers, middle schoolers, high schoolers, and college baseball players. Command was looked at holistically but also separated into two categories: “form” and “release timing.”
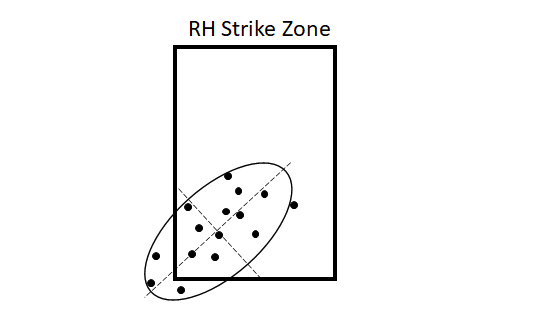
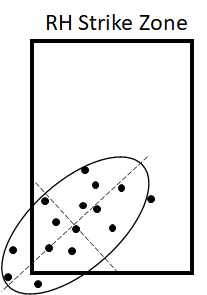
The way these are separated, release angle (what they attribute to “form” or mechanics), and release timing, is very interesting. The location spray charts that were measured in this study generally followed an ellipse-type shape of which the orientation matched the athlete’s arm slot.
For example, the righties had ellipses that were rotated clockwise. This ellipse was then evaluated by measuring the length of the “minor axis” (the shorter dashed line in the figure below which the authors attributed to mechanics) and the “major axis” (the longer dashed line in the figure below which the authors attributed to release timing.
Along with pitching velocity, they found that the following performance command metrics were affected by age group:
- The spread (area of the confidence ellipse) of pitch locations around the target generally decreased with age; meaning, older pitchers were generally more accurate and had a smaller spread of pitch locations.
- Specifically, the minor axis (corresponding to mechanics) decreased more with age than the major axis (corresponding to release timing).
Theoretically, older athletes had improved release/arm slot *angle* consistency and/or release dynamics of the baseball but did not show significantly more consistent release timing.
This study is limited in generalizability by the setting in which data was collected since the participants didn’t need to compete against an opponent and they weren’t pushed to throw their pitches as hard as they could, but this is a very interesting approach.
Separating the pitch location spread into two directions corresponding to different aspects of command or control seems like it might be a good way to get more granular with the skill of command without collecting actual movement data from the pitcher. This is even something you could do with publicly available MLB pitch data—tag us on Twitter if you run some cool analyses @DrivelineBB.
The validity of the Push Band 2.0 to determine speed and power during progressively loaded squat jumps
With sensor-based products ever increasing in the baseball and sports training space, validating these products and understanding their respective strengths and limitations is important. In fact, as many of you likely know, much of the work in our research department involves validating measurement technology. One such technology used for training is an IMU-sensor-based velocity measurement tool that is used for strength and conditioning purposes.
Orser et al. at the Canadian Sport Institute completed a validation study of the Push Band 2.0 for tracking bar velocity in a squat jump. The authors compared Push Band’s measurements to force plate measurements, assuming that force plates are the gold standard for velocity and power measurements.
Bar velocity is often measured to assess power and speed in the weight room and/or provide training feedback for athletes during their sessions. This can be done with a cable-type system like the Tendo device or can be done with movement sensors like those used in the Push Band. We have done an abbreviated validation test for a couple of similar products (Push included) that can be found here, but these authors completed a more involved and robust evaluation of the Push Band.
The Push Band during the squat jump:
- Showed significant correlations to force plates for velocities and power
- Overestimated mean and peak velocity as well as mean power but underestimated peak power
- Had lower, reasonable error for mean velocity (< 12.8%) and higher, less reasonable error for mean power (< 34.5%).
- Showed increasing error as velocities increased
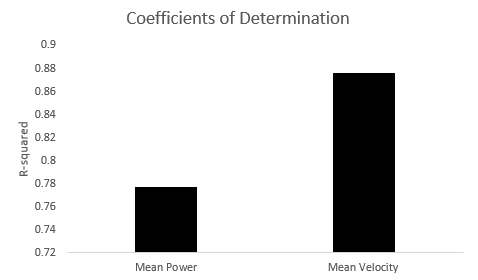
Coefficients of Determination between the Push Band and Force Plates (more is better)
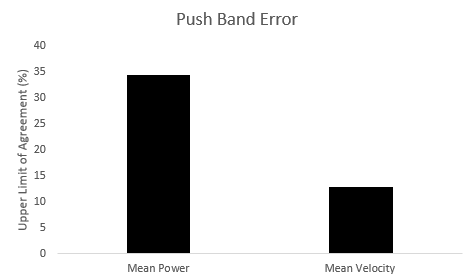
Upper limit of agreement between Push Band and Force Plates (less is better)
The authors’ main takeaways are that Push can be used as a reliable velocity measurement tool but not to estimate power. They discuss a couple of reasons why the observed error in power was so high, one of which being their bucketed analysis which analyzed each load individually (less loads, higher velocity, higher error trends).
The other main consideration they discussed was the difference in models for how power is calculated by Push and by the force plate software they used, a conversation for another blog but a likely reason for some of the large error in power. All things considered, bar velocity can still be used for training feedback to drive intent in the weight room, so the results of this study (and our abbreviated in-gym analysis) suggest that Push may be a usable option for adding some feedback to your weight room—even if it doesn’t estimate power very well.
Foam Rolling Prescription: A Clinical Commentary
Many athletes use foam rolling in their warm-up protocol.
There are some conflicting opinions and some conflicting commentaries on the usefulness of foam rolling and its tangible effects. These potential effects include movement effects, performance effects, and even more subjective measures like comfort level.
This commentary by David Behm and others reviews the foam rolling literature and uses effect sizes to measure how the number and duration of sets among other aspects of foam rolling technique affect range of motion, performance, and fatigue. With very low effect sizes on performance (jumping and sprinting) and fatigue (small sample), this study’s analysis suggests that the best increases in ROM come when the foam rolling involves:
- 1-3 sets
- 2-4 second repetitions
- 30-120 seconds for each set
These are broad suggestions that leave a lot of room for individuals to adjust how they see and feel is fit for their case, but at the very least, it shows that foam rolling for an hour before your workout may not actually provide many benefits.
One major thing to keep in mind is that this review includes studies investigating foam rolling on various joints/body segments, with different foam rolling protocols and different measurement types. As always, take these results with a grain of salt, but we can be confident that a little bit of foam rolling in a warm-up protocol can be worthwhile.
Comment section