The Value of Data in Player Representation
Table of Contents
Introduction
Significant Metrics: Pitching Athletes
Significant Metrics: Hitting Athletes
Concluding Thoughts
Introduction
Why does the tweet above matter so much?
Well, because it represents the future.
Bitsko, a cold-weather HS arm whose entire season was canceled due to COVID-19, was a relatively late riser without an established track record. Without teams being able to see him in person leading up to the draft, Bitsko ran a real risk of not being able to capitalize on his vast improvement over the past few months.
However, despite the economics and surrounding uncertainty stacked against him, Bitsko found himself selected 24th overall by Tampa Bay.
Yet people continue to wonder, how does a 17-year-old with relatively no “track record” convey to MLB organizations that he is worthy of first-round money and their trust?
Kiley McDaniel explained it well in an article that came out just a week before the draft. Whether via social media, Zoom interviews or even data sharing, Bitsko was able to present his value and potential in “unique” ways.
That said, those ways won’t seem so unique for long.
Player representation (whether that be agents or the athletes themselves) face a new world.
Honestly, all in baseball face this new world.
No longer are athletes able to push forward and understand their value to the fullest extent without the use of technology and data. The information and significance it provides has been accepted by those at the highest levels of the game, and its utility continues to expand with increased investments of money and time.
To a process that was exclusively determined through anecdote and experience with minimal quantitative support, “New Data” provides a supplementary resource that bolsters the efforts, accuracy and strength of those in player evaluation. It is time that athletes and their representation start to understand the gravity of the situation and take the proper steps towards being prepared.
Though the focus of this piece is largely the use of data in player representation at the professional level, much of the information can certainly be understood and used at lower levels of the game as well. Ultimately, the point of this piece is to empower players and their representation with a better understanding of what data points are considered valuable in the game, and then hopefully to lead some to pursue a better understanding of themselves.
This understanding will ultimately lead to more transparency and clarity as negotiation and projection occur between players/agents and organizations.
With all of this being said, the future is here.
Data, Technology & the MLB
The league as a whole has invested in understanding the utility of new data, but the majority of agencies have remained rather on the fence. The truth is that this information will be used to evaluate their players whether they like it or not.
Every organization in the MLB utilizes some form of technology and resulting quantitative data to evaluate and develop players. Some are more advanced than others. They can be sectioned out as such:
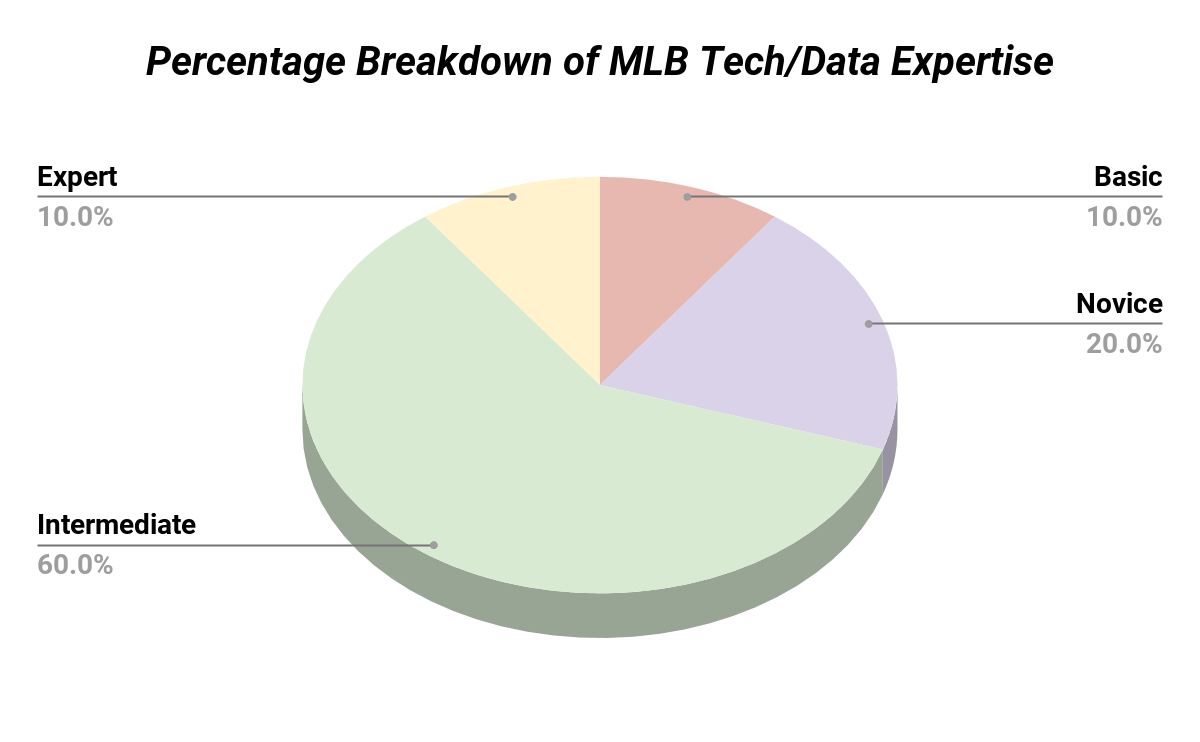
Tier 1: Basic – Traditional Methods: Radar guns + stopwatches (~10%)
Tier 2: Novice – Early Stages of Integration: Have purchased tech, but have limited staff/expertise in utilization, analysis and implementation of data (~20%)
Tier 3: Intermediate – Partial Integration: Have/use progressive technology; employ staff that can implement technology, but do not currently leverage this information to its fullest potential and utility (~60%)
Tier 4: Experts – Fully Integrated: Have current data-driven systems in place and push initiatives to better understand the strengths/limitations of new technology in player development (~%10)
~90% of all organizations are moving towards a new, modern form of assessment and athlete valuation in Player Development.
Current Landscape
More effective methods in assessing athlete value calls for new, more effective ways of promoting athlete value.
With more public access to technology and data over the past few years, this topic of competitive advantage for organizations over athletes and their agents is nothing new. But reactions to this information have been very slow. R.J. Anderson of CBS wrote about this exact subject in a 2017 article.
In many ways, he predicted the less than hasty reaction, stating that agents tend to believe their job is to read and react to the market and not to create one using analytics. Well, this may not be the market they wanted to be a part of, but it is definitely one they need to be attentive to now.
With this being said, agents and athletes definitely pay more attention to mainstream analytics as of late, but they may not be paying attention to the whole picture. Many focus on trends, Sabermetrics, and general statistics but go without a general understanding of the utility of Player Development metrics in valuation. And the way it is today, if an agent goes into a negotiation without this holistic understanding, odds are high that he/she will be the less prepared party.
As stated previously, “New Data” has a brand new utility. Historically, it was exclusively used with a Player Development focus in mind, rather than, say, production. This former focus lends a unique strength in a new role. Thanks to new data’s Player Development centric approach, one can now quantify projection in more reliable ways. Naturally, this updated ability introduces a new disparity between the “haves” and the “have-nots”.
Not understanding this section of analytics now introduces a brand new set of risks—risks that have direct effects on all aspects of the game. And the truth is that it falls on the player and their representation to understand this utility and ultimately the value it offers them.
The Value of Data in Representation
Data provides evidence to supplement anecdote.
In a landscape where experience and dogma served as the principle directors of action, data now provides the information necessary to either confirm or refute the legitimacy of those past decisions.
How often do you throw that pitch? How do we develop this athlete? Who do we sign?
These are all questions that can now be answered with more confidence and accountability. That said, as helpful as advanced data and the greater acceptance of its use can be, it can serve as a double-edged sword. It leads to more transparent conversations and effective player development strategies, but can also lead to the exploitation of those who do not understand the value certain data points present.
Due to historical thinking, progressive teams are able to negotiate under the premise that player production declines over time. With graphs such as the one presented below, many have accepted this statement to be unfortunately true.
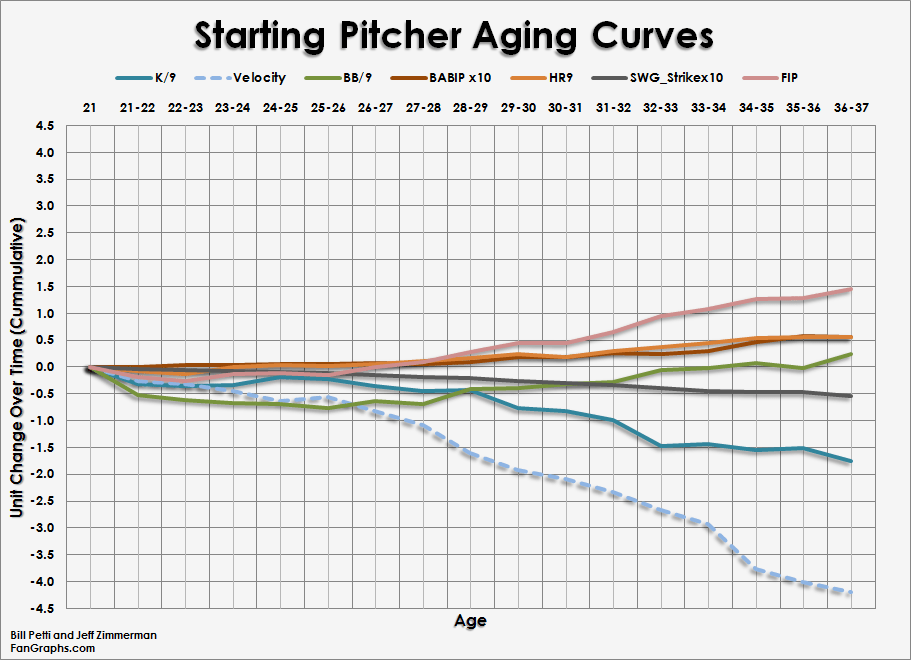
Fangraphs.com – Starting Pitcher Aging Curves 2012
However, for certain athletes who have not realized their fullest potential, this assumption may not necessarily be accurate. Considering evolutions in player development in addition to updates in player utilization tactics such as Optimal Usage Percentages or Pitch Valuation, organizations now have the ability to negotiate using trends as their trump card, thus receiving valuable assets for discounted rates. To put it simply, teams can sign a veteran for cents on the dollar due to his age, even though their analytics project that his best playing days may still be ahead of him.
In addition to this, organizations are now able to get a leg up on younger athletes as well. Decision-makers are more capable of “ripping” the draft with a greater utilization of new data. Ultimately, organizations can low-ball signing bonuses for athletes they actually want and value very highly, yet the athlete and their representation do not understand how valuable they really are and therefore are missing out on being reimbursed for their “true” value.
A unique understanding of significant metrics specific to each athlete is the source of this value. This understanding has changed the trajectory of many careers and it will continue to do so for many more, especially as such tactics become even more commonplace.
Valuable Metrics for Pitching Athletes
In recent times, a team’s ability to not only recognize but more importantly utilize the unique strengths of each specific athlete has ultimately become the turning point in some careers that most felt were destined for less success.
Similar processes are being utilized in the assessment, signing, and development of younger players as well. With this being said, it has become clear that there are metrics in baseball player development that are more prized than others, yet are not necessarily monetized in the same way.
For pitchers, there are three specific places where athletes can build value:
Velocity, Spin, Strikeouts/Arsenal Optimization
Velocity
Admittedly, this is an easy one and I don’t expect anyone to be impressed with its introduction here. But I’d be remiss to not have at least a brief section highlighting the most valuable metric in a post about valuable metrics solely because people already know it is important.
The truth remains: velocity is the sexiest topic in baseball. Reasonably so.
No matter what anyone may have to say on this matter, nothing makes ears perk up and wallets open quite like a number with three digits on a radar gun.
In past years, velocity and the methods to increase it were relatively unknown or at least remained unproven. Yet, this has changed. With boosts in research, implementation, and technological advancement, the ability to bolster one’s ability to throw hard is more accessible and possible than ever before. Whether it be biomechanical analysis and resulting drill prescriptions, mobility increases, or other forms of velocity building programming, athletes now have the ability to push for more velocity. And the results of pursuing such a thing can be very beneficial to one’s career.
Oliver Drake is a strong example of this. Consider that in the early years of his career, Drake sat around 90mph and was seen as an average journeyman at best. Boosting his velocity to an average of 92-94 mph (even touching 96) has placed him in a pretty opportune position with Tampa Bay. Drake’s performance in the Ray’s impressive relief battalion can in many ways be attributed to a general improvement in many facets of his craft, but a significant velocity increase remains the most significant change.
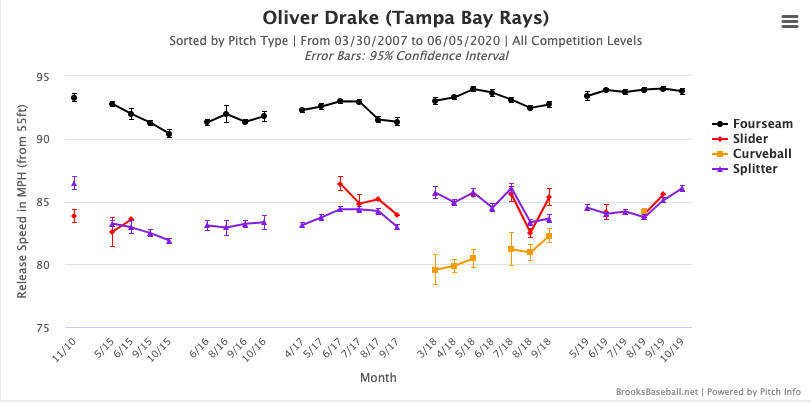
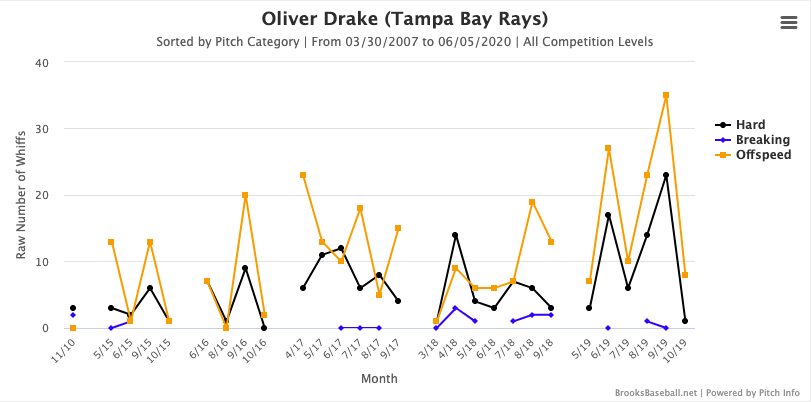
Brooks Baseball Velocity vs. Raw Whiff Rate – Oliver Drake (2015-2019)
As demonstrated by the two graphs, the whiff rates on both his split and four-seam have seen drastic upticks as his FB velocity has increased. Ultimately, a more effective fastball has made the rest of his pitches more effective, and, in turn, has resulted in greater success. Naturally, there are many facets that go into the success of an athlete, especially a relief pitcher, but it is a glaring truth that an increase in velocity has been significant in the revival of a once discounted career.
Spin
On a lesser known yet similarly significant note, “Spin” has quickly become a sought after metric. With significant developments in technology and pitch physics tracking capabilities, the encompassing metric of “Spin” and all of its significant sub-sections have been placed in the spotlight.
Spin Axis. Spin Efficiency. Spin Rate. Vertical Break. Horizontal Break. True Spin. And more.
The list is long. But it is all very important. Each one of these components plays a significant role in determining what makes a specific pitch effective. And naturally so.
In this section, I’ll be focusing on the significance of Spin Rate.
Spin Rate remains one of the newer metrics to receive significant public attention, and for the sake of keeping this post relatively brief, I will only offer a short synopsis of this metric. For a deeper dive into Spin Rate, please refer to Driveline’s two-part series: Spin Rate Part 1: What We Know Now + Spin Rate Part II: Spin Axis and Useful Spin.
Some key points for Spin Rate:
- Measured in RPM (revolutions per minute)
- The ‘average’ pitcher would have a 92 MPH fastball with a spin rate of 2200 RPMs
- In reality, pitchers can throw 92 and have spin rates ranging from 1800 to 2400 RPMs
When it comes to the great allure surrounding Spin Rate, much of the attention is placed on those of the high spin variety. Though there are significant usages for those with lower spin, having higher spin on pitches ultimately presents more potential, and this is what has progressive organizations fiending for more. A strong example of this is the Houston Astros targeting Ryan Pressly. Pressly is now seen as a “Spin Guy”, but it took an organizational change to realize that.
The truth is that Pressley now stands to make several million dollars more because he got “lucky” and was traded to the Astros. In a 2018 article, FanGraphs went into great detail regarding Pressly’s unique skill set and Houston’s ability to utilize it and build his value. This situation is a strong example of how progressive teams are now operating. For a more detailed explanation of Houston’s targeting of Pressly, check out this article from MLB.com.
TL; DR
Pressly started throwing fewer fastballs. Threw more curveballs. And when he did throw fastballs, they were up in the zone.
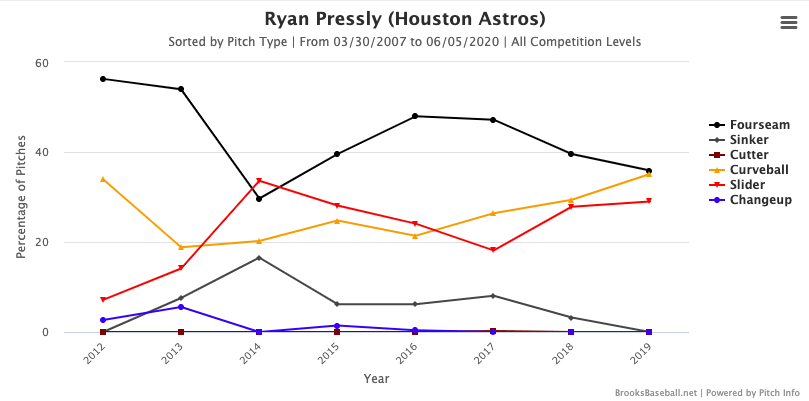
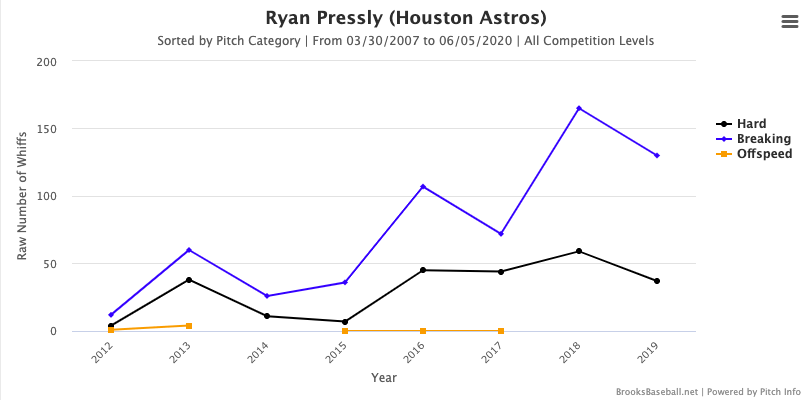
Brooks Baseball Pitch Usage v. Raw Whiff Rate – Ryan Pressly (2012-2019)
These arsenal utilization changes are the exact reason Pressly has been considered one of the best relievers in the game and it is a direct result of an understanding of his talents in regard to Spin. The Astros knew enough that they could use him better than others. And they more than likely got more “bang for their buck” because of it.
In 2019, Pressly ranked very high in K%/Whiff%/FastballSpin/xwOBA and was in the highest percentile for curveball spin according to BaseballSavant.
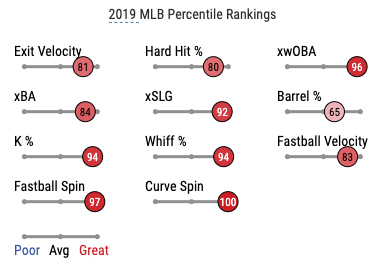
Baseball Savant – Ryan Pressly Percentiles 2019
Without an organization realizing Pressly’s unique skill set, it is possible that these significant metrics could have continued to be deemed meaningless and ultimately Pressly’s career would not have realized the same success.
Agencies should be incorporating the true value of being acquired by a team such as the Astros, or at the very least, begin seeing the significance of knowing which teams understand unique skill sets and the great importance of properly using them. Obviously, a player falling into the right organization can serve as a trampoline for effectiveness and success.
In the simplest of terms, this means more money.
But agencies also cost their players (and subsequently themselves) millions by having a bunch of underdeveloped Ryan Pressley’s on their client list. Without an athlete coming to understand fully their specific skill set and resulting utility, they are unable to see that even though they may not be experiencing maximal success and strong results currently, with the proper change (whether it be in mindset, utilization, or even a change of physical location) a massive direction change can occur in regards to their career.
Strikeouts/Arsenal Optimization
When all things come together right for a pitcher, a strikeout is the best result possible in the game. With understanding the utility of the metrics expressed in the past two sections, Strikeout/Arsenal Optimization are the most significant aspects a pitcher can push forward in regard to value.
As was stated in the previous section, understanding is the initial cause of finding this value. One can throw hard all they want or spin the ball as much as they please and still not realize success if they either don’t know how to use what they have or are led to misuse their talents.
There is no greater example to demonstrate this situation than the career of Gerrit Cole.
Gerrit Cole’s time with the Pirates was less than stellar. Sure, many had very high expectations for him considering his high draft pick status and impressive raw tools, but it appeared that things just weren’t working out for him.
Fast-forward a few years and he is a member of the New York Yankees and has signed a contract for over $300 Million.
So what changed? Like Pressly, a change of scenery and arsenal usage was a career catalyst for Cole.
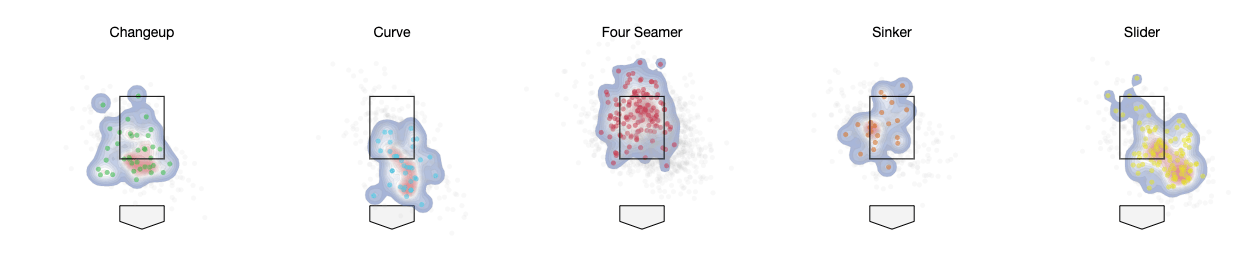
Baseball Savant – Gerrit Cole Location Plot 2016
In the early stages of his career, Cole predominantly resorted to his off-speed pitches as his out pitches, whether it be his slider, changeup, curve, etc. Very rarely did he go to his high-velocity fastball. That changed when he moved to Houston. With a greater understanding of his specific skill set and the metrics that come with it, Cole’s arsenal usage changed completely.
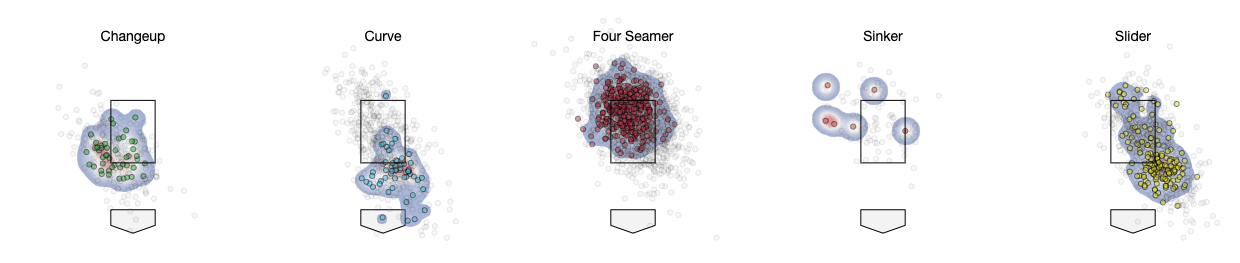
Baseball Savant – Gerrit Cole Location Plot 2019
He lived up in the zone with his high-spin fastball, which also served as his primary out pitch. This, in conjunction with his already strong off speed pitches, ultimately made Cole into the $300 Million Arm that he was always projected to be. What was once very hittable a few years before ultimately became untouchable. In the 2018 and 2019 seasons, Cole’s Whiff% and Putaway% all saw major increases, while his general pitch metrics (mph/spin-rate) remained relatively the same.
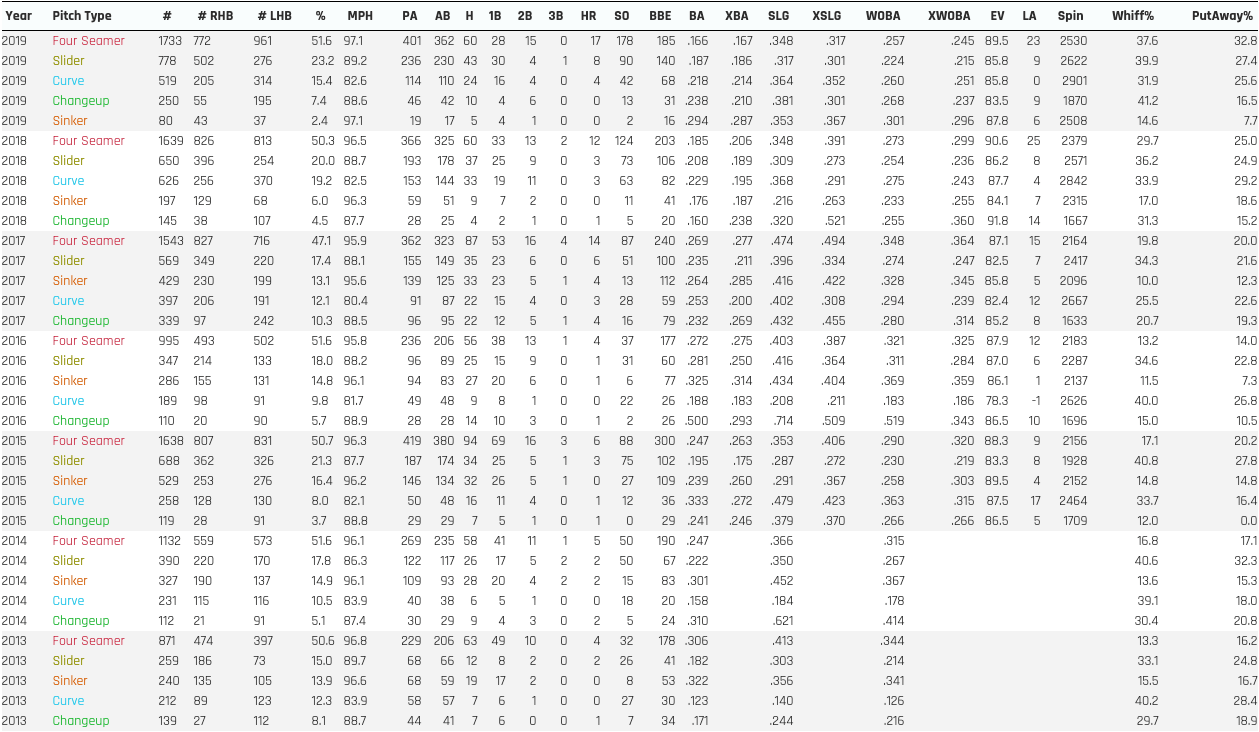
Baseball Savant – Gerrit Cole Career Statistics
So why, with the same stuff, would Cole become exponentially better?
The answer is Arsenal Optimization. Through the usage of data and a stronger understanding of that data, the Astros were able to maximize the utility of Cole’s abilities and ultimately bring him to the level of value that was once expected from him.
While it appears to be very intuitive, many in the game don’t fully see how significant a role data can play. If a few minor adjustments can change the trajectory of a career like Gerrit Cole’s, it is very possible that the same adjustments can be made for many others.
With the resources publicly available today, any and all athletes are able to come to understand their unique skill sets to the extent that Gerrit Cole knows his. They do not have to sit back and be utilized in ways that are not optimal. For those in athlete representation, this fact could not be more important.
Valuable Metrics for Hitting Athletes
Though slightly behind on the timeline of development in comparison to Pitching, Hitting athletes also face a new world in regard to the utility of data in representation.
Many understand that hitting is in a less controlled position than pitching. But with recent developments in technology and understanding of the resulting data, hitters are now more equipped than ever to boost their effectiveness and value.
Like with pitchers, there are a few particularly significant metrics that organizations and decision-makers focus on in regard to hitters.
Those would be:
Attack Angle, Bat Speed, and Average Launch Angle of Hard Hit Balls.
Attack Angle
Everywhere one turns, there are discussions on the proper way to approach the ball during a swing. The long established idea is to get the bat to the ball in the “quickest way possible”. For many, this results in a very short, direct path to the ball (shown on the right).

Through anecdote and qualitative thought, hell, even to the eye alone, this thought process makes sense. Point A to Point B in the most direct fashion sounds pretty quick. And being quicker sounds pretty good, right? Well, with time, a greater understanding has been developed. Though deemed the “quickest”, a direct path is not the most effective way to swing the bat.

With this being said, athletes have pushed forward a new focus on adjusting their attack angle. And many have seen great results because of it.
A strong example of this would be Christian Yelich.
Early in his career in Miami, Yelich was already very effective and had made a name for himself as a hitter—yet he was lacking power. While in that organization, he worked with his then hitting coach, Barry Bonds, towards developing more (listen to Yelich’s account of this experience here).
It did not click right away, but it appears that in his new posting in Milwaukee he has found a way to compound off of his early successes. Yelich has added more “power” and has ultimately become a perennial all-star and MVP because of it. Though there are many reasons that Yelich has attained even higher levels of success and effectiveness, adding a bit more loft to his swing can be directly accredited as one.
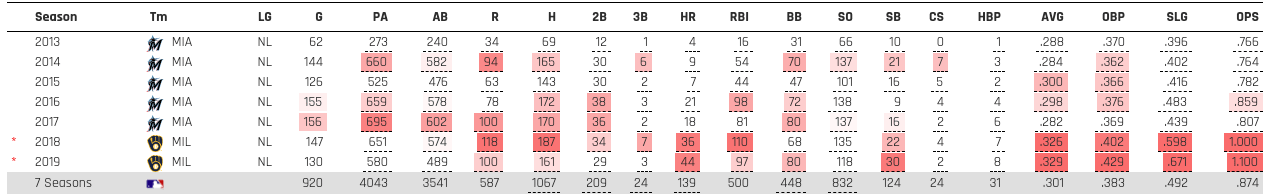
Baseball Savant – Christian Yelich Career Statistics
In comparison to his first few years in the league, 2018 and 2019 were noticeably better. One might directly attribute this to more experience in the league or some other anecdotal reasoning. But in regard to quantitative evidence, one fact stands out: Yelich added loft to his swing.
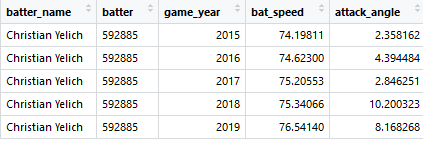
Dan Aucoin – Driveline Baseball Analytics
A 6-8 degree increase may not seem like much, but the statistics and awards show. Not only did Yelich’s bat speed increase with the change, his barrel % also increased. Whether it be slugging percentage, average, or simply HRs, Yelich was just better after making some changes.
Now, why am I introducing this? Obviously, any agent would love to represent an MVP. But the most significant point is that hitters—all hitters, even Christian Yelich—can boost their effectiveness and value through change. They just need to know specifically what to change and why. Organizations are looking for athletes that have strong attack angle metrics already or those whose attack angle can be positively changed in an efficient manner. This is where assessment becomes so important.
Directed training and development is now more possible than ever and it continues to produce results. Athletes are not limited to solely being directed by their organization. They can take back a bit of control and lead their own development with help from their representation and outside help.
Bat Speed
Another metric that organizations hold in a higher significance is Bat Speed. As bat sensor data starts to become more readily available, it is very possible that Bat Speed will become the metric of the future. In many ways, like Spin Rate for pitching, Bat Speed represents potential.
The presence of higher Bat Speed projects to higher exit velocity and also provides athletes the opportunity to make up space in inopportune positions. And just as organizations are looking for Spin Rate in the pitching athletes they scout/sign, the same can be said for organizations with athletes and Bat Speed.
The Tampa Bay Rays are a prime example of an organization that targets specific athletes due to this metric and its resulting effects.
Whether it be Yandy Diaz, Ji-Man Choi, Hunter Renfroe, or Avisail Garcia, the Rays have made it clear that their offensive direction includes guys who can swing the bat hard.
And they are not the only organization that is doing this. Teams are willing to pay for this metric on the open market and it appears that agents aren’t aware. There is very little reason that the Tampa Bay Rays should be the top bidder for Avisail Garcia. This is not a knock on the Rays or Garcia, but a call to agents to pursue a better understanding of why the Rays want someone like Garcia over the other athletes available. If anything, this knowledge will at least boost their understanding of how to best market their clients to an evolving league.
In many ways, this is similar to the pitch-framing phenomenon of the early 2010s. During this time, organizations were signing 1-2 WAR players at league minimum because agents weren’t completely aware of the marketable and deeper value attributed to their clients.
Sure, the recent development of a statistic like WAR has made that failure more apparent, but that is exactly the point of this blog: to bring significance and light to metrics and value that could possibly be going underappreciated—or just simply missed.
Average Launch Angle of Hard Hit Balls
The last metric that will be highlighted for value in hitting athletes is the average Launch Angle (LA) of Hard Hit Balls (HHB; HHB is the Top 10% of average Exit Velocities). Much like the Strikeouts/Arsenal Optimization section for Pitching Athletes, this is more so a result of metrics mixed together to present the fullest and truest value.
At Driveline, we focus on the average LA of Hard Hit Balls (HHB) as a key metric. With this metric, we are generally able to project the type of production a player is capable of achieving. Ideally, we aim for 20 degrees, but the effective range of HHB-LA rests between 15 and 25 degrees. With all of this being said, why is this a metric we find important?
Well, it helps predict production. If the average LA of HHB is negative or in the single digits, the highest potential for production remains very low. The athlete is generally just hitting the ball on the ground or at people and is inherently limiting themselves to singles and hopefully doubles if they are quick enough.
As this Average LA of HHB increases towards 10, 15, 20 degrees, the athlete will start realizing much more production (Extra Base Hits and HRs). It is this production that organizations are ultimately pursuing, and they have much better ways to catalog and acknowledge the potential of this in prospective or current athletes.
An example of an athlete who demonstrates this strong mixture of metrics is the reigning NL Rookie of the Year, Pete Alonso.
In his rookie campaign, Alonso was noticeably better than other rookies. Not just those in 2019, but all rookies. Ever.
![]()
Baseball Savant – Pete Alonso 2019 Statistics
Just look at the statline. 53 home runs. 120 RBIs. Almost .600 slugging. The kid just produces. But how and why he produces is what is so significant. He ranks high in exit velocity, but it is his average launch angle on hits that made him stand out.
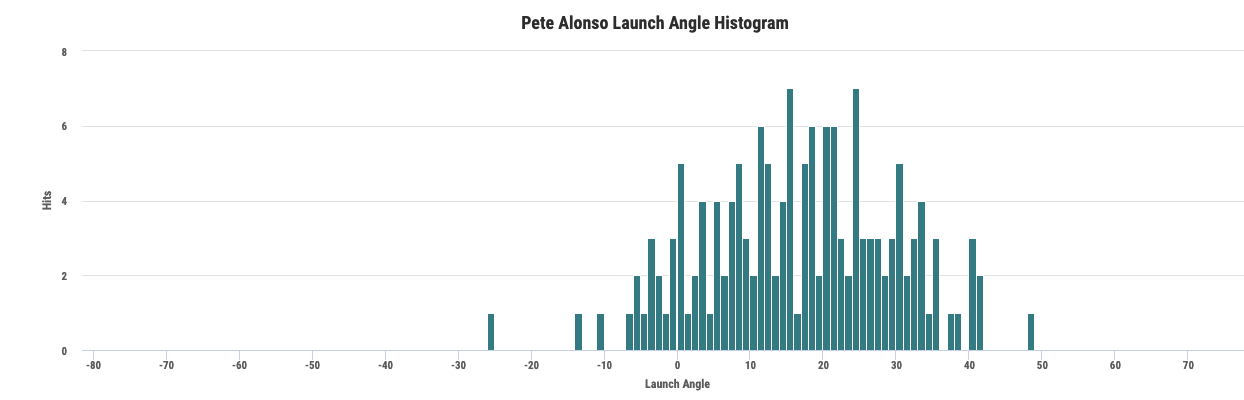
Baseball Savant – Pete Alonso Launch Angle Histogram 2019
As one can see in this diagram, a majority of Alonso’s hits fall within the 15 degree and 25 degree range that we at Driveline consider the “production zone”. Obviously, there are many things that push for Alonso to be considered effective, but this lone fact is a powerful predictor of production. As athletes train, it is important for them to have this understanding of production as their final destination.
This is the importance of data and deliberate training. Growing up with the understanding that the pinnacle of hitting training is squaring a ball up and having it go to the back of the cage is harmful to production. For the coach who relies solely on anecdote or qualitative feedback, this is what you know and how you demonstrate your expertise.
Yet, this is not how organizations at the highest levels are going to value your athletes. Analysts and data-driven coaches are able to develop more production through understanding production ranges and directing athletes’ training towards those goals. Regular cage sessions that serve as glorified “feel time” are then deemed relatively inefficient and are not the best use of an athlete’s time.
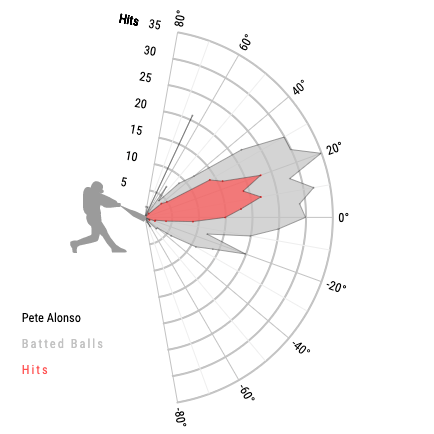
Baseball Savant – Pete Alonso Launch Angle Diagram 2019
Providing athletes with diagrams like the one shown above while also supplementing this graph with visual representation of ranges in the cage promotes a form of production driven training that the hitting world has never seen.
Concluding Thoughts
For agents or those in athlete representation, this explanation should bring up two questions:
- Is my athlete playing the game correctly to maximize their production?
- Is my athlete doing the proper training to understand if they are playing the game correctly and maximizing their production?
More and more, athletes and their representation are learning what creates value, and, in turn, they are learning what makes them valuable.
It is my hope that they will start learning to promote their “true” value that much more. With greater public access to the tools and processes utilized to assess, develop and implement such tools, it now falls on the player (and their representation) to come to understand these new processes and act accordingly.
With this being said, we provide specific Agency Resources that serve to bolster the efforts agents are making for their clients as the game and athletes evolve.
Agency Resources
Through a combination of Education, Athlete Training, and Supplementary Products, Driveline Baseball is able to boost any and all agents’ efforts in supporting their clients’ development and careers.
EXAMPLE SOLUTION #1:

Utilizing cost-efficient resources such as blogs, DrivelinePlus or Certifications, agents would gain a better understanding of how to manage their clients’ development and training. Seen as a more self-driven approach, agents would provide their athletes with the knowledge and training tools needed to further enhance their careers.
EXAMPLE SOLUTION #2:

In a more guided approach, agents would build the understanding needed to boost their clients’ development while also engaging directly with Driveline Baseball to accomplish the task. By sending clients to Seattle for off-season training and purchasing supplemental tools for use while away from Driveline, agents would provide their clients with a beneficial, year-round approach.
EXAMPLE SOLUTION #3:

An example of a full-fledged plan, agents would be able to build a full player development partnership with Driveline Baseball covering all facets of the process. From education to implementation, to further engaging processes such as draft reports or On-Site Assessments, agents would be able to give their clients and their agency the best opportunity to continue to develop and achieve success at all times of the year.
Agents now have the ability to self direct the evolution of their representation, opt into a more guided form of development, or move towards a partnership with Driveline in which we work together to create the most advanced form of representation possible for your agency.
For more information, please visit https://www.drivelinebaseball.com/agents/ or email/call into Support at support@drivelinebaseball.com or (425) 523-4030
By Tosh Semlacher
Comment section